Sunday, 28 July 2019

Reference Architecture Layout for Data Center-DR Data Center [IT-013]

Reference Architecture for Data Center-DR Data Center
Status: WIP, Last Updated: 20190728_1427

Objective:
There are so many terminologies, technologies involved in overall architecture of typical data center and usually its overwhelming for average technical engineer. This blog intend to simplify all those technologies and position it belong in overall architecture with simple reference layout.

Terminologies:
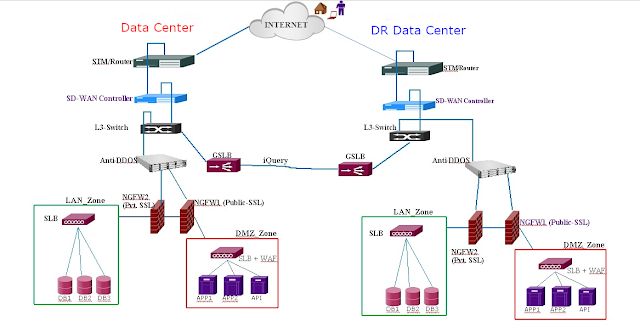
* GSLB - Global Server Load Balancer (By centrally manipulating Enterprise DNS Server, we could provide high availability, survivability as each Name Resolution provide different IP addresses depends on various conditions. GSLB shall be positioned at each of Data Center.)
* SLB - Server Load Balancer (To abstract internal IP addresses, Load Balancing between applications)
* SD-WAN - Software Defined Wide Area Networking (Provide Link Load Balancing, L7 QoS, Link Encryption, Site router between DC & DR)
* SSL Gateway - Encrypt/ Decrypt SSL traffic, usually associated with 'https:// ...'
* SSO - Single Sign On (Provide unified login for central authentication)
* NGFW - Next Generation Firewall (L7 layer firewall capability)
* DMZ - De-militarized Zone (Host internet exposed services & servers, while keeping internal servers securely within 'Militarized Zone ie local LAN. 'DMZ shall have public IP addresses, while MZ to have LAN IP ie non-routable IP addresses. DMZ/ MZ shall improve overall infosec)
* STM Router - Synchronous Transport Module (TSP provider CPE ie last mile from TSP)
* TSP - Telecom Service Provider (BSNL/ MTNL/ AirTel/ PowerGrid providing MPLS links)
* CPE - Customer Premises Equipment
* DDoS - Anti-Distributed Denial of Service


Reference Architecture Layout:

Monday, 22 July 2019

Command Center Video Wall [IT-012]


Command Center Video Wall [IT-012]

Last Updated: 20190728_1434

Objective: To build large command center video wall to monitor all IT infrastructure, IT applications under one roof.

Key requirements:-
(a) Video Wall Size : Approx. 30' x 10' & 10'x10'
(b) Zero-Bezel
(c) Minimum life of panel: 1,00,000 hours with 24x7 rating

Vendor Landscape:-
(a) Barco
(b) Christie 

Barco Models:-
- Laser, Full HD (1920x1080), 16:9 aspect ratio, Redundant LED, Redundant inputs
- Bezel: 1mm
- Budgetary Cost: ₹.9 Lakh ($13K) per panel of 70" excluding taxes

- - Full HD (1920x1080), 16:9 Aspect ratio, 800cd/m2, Contrast-4000:1, Backlight lifetime: 100000, Fanless cooling, Zero-Bezel width, HDMI-02 Ports/ USB-02 Ports/ DPI-02 Ports
- UniSee Mount can support upto 10 rows in landscape mode and 6 rows in portrait
- Bezel: 1mm (Practical)
- Budgetary Cost: ₹.5.5 Lakh ($8K) per panel of 55" excluding taxes


Photo Gallery:-
(a) Barco UniSee, 6x2, Security, Taebaek City, South Korea


(b) Barco UniSee, 7x7, Control Room, Kansas, USA


(c) Barco UniSee, 6x2, Security, South Korea

Jeollanamdo disaster status control center

(d) Barco UniSee, 4x10, House of Worship, Seoul, South Korea

House of worship

(e) Barco Laser ODL-721, 


(f) Barco Laser ODL-721


(g) Barco Laser ODL-721


Demo of Tableau Software for Command Center Data Visualisation [IT-011]

Demonstration of Command Center Data Visualisation
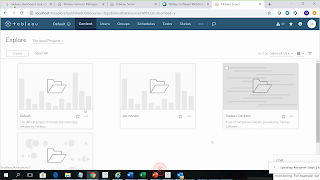
(Tableau Desktop & Tableau Server) on 21 Jul 2019

Objective: Command Center Data Visualisation (CCDV) to monitor all of IT infrastructure, IT applications and Information Security of organisation. 

Technical Requirements
(a) CCDV expected to get data from various sources using native connectors including Key:Value stored in NoSQL database such as MongoDB/ Oracle, PostgreSQL, REST API, Excel Files, Hadoop. CCDV should provide rich set of configurable Charts/ Graphs.

(b) Auto-refreshing views, Black Background. Dashboard layouts for big screens, Seamless screen, instant refresh rendering more complex dashboards, Script to refresh view on background, Display to use entire canvas, Support of minimum 1920x1080 and upto 4K, Guided analysis

(c) Graphs/ line charts support:  Bullet graphs, Bar graphs, Data labels, Line graphs, Spark lines, State indicators, Tabular data, Infographic, Column Chart, Line Chart, Pie Chart, Doughnut Chart, Bar Chart, Area Chart, Scatter Chart, Bubble Chart, Pictorial Chart, Pyramid Chart, Funnel Chart, Gauge Chart, Radial Chart, Rose Chart, Heat Map, Tree Map 

References

Last updated: 20190722_0552