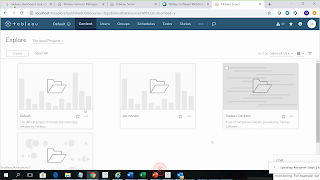
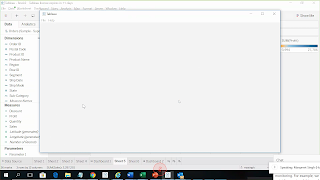
Demonstration of Command Center Data Visualisation
(Tableau Desktop & Tableau Server) on 21 Jul 2019
Objective: Command Center Data Visualisation (CCDV) to monitor all of IT infrastructure, IT applications and Information Security of organisation.
Technical Requirements:
(a) CCDV expected to get data from various sources using native connectors including Key:Value stored in NoSQL database such as MongoDB/ Oracle, PostgreSQL, REST API, Excel Files, Hadoop. CCDV should provide rich set of configurable Charts/ Graphs.
(b) Auto-refreshing views, Black Background. Dashboard layouts for big screens, Seamless screen, instant refresh rendering more complex dashboards, Script to refresh view on background, Display to use entire canvas, Support of minimum 1920x1080 and upto 4K, Guided analysis
(c) Graphs/ line charts support: Bullet graphs, Bar graphs, Data labels, Line graphs, Spark lines, State indicators, Tabular data, Infographic, Column Chart, Line Chart, Pie Chart, Doughnut Chart, Bar Chart, Area Chart, Scatter Chart, Bubble Chart, Pictorial Chart, Pyramid Chart, Funnel Chart, Gauge Chart, Radial Chart, Rose Chart, Heat Map, Tree Map
References:
Last updated: 20190722_0552


Don’t be afraid to stroll away from a wager right earlier than the game. Odds change, lines change, and level spreads change, and when you're not confident a 실시간카지노 few wager, both don’t make it or reduce the wager. It definitely does pay off—to the tune of up to as} $2,000 in common customer lifetime worth in some cases, in accordance with Stone. While that number is attractive to gambling operators for obvious reasons , it additionally has the potential to be an issue for both the business and its clients. Do not contemplate gambling as a way of earning money, and solely play with money you could afford to lose.
ReplyDelete